Metrics
User behavior tracking for consumer apps
Track in-app events as Trophy metrics and power gamification features like streaks, achievements, points, leaderboards, and lifecycle messaging. Attach custom event attributes to drive complex features.
// Track lesson completions in Trophy
const newState = await trophy.metrics.event('lessons-completed', {
  user: {
    id: user.id,
    tz: 'Europe/London',
  },
  value: 1,
  idempotencyKey: 'lesson-id',
})

// React to state changes
const newStreakLength = newState.currentStreak.length
const unlockedAchievements = newState.achievements
const newPointsAwarded = newState.points
Powering gamification experiences for 1M+ users









Learn why product teams trust Trophy. Read our customer stories
Use case
The event layer for gamification features
Define custom events in the dashboard and send from your server or client code.
- Achievements
- Unlock badges when a metric crosses an event threshold you configure in the dashboard.
- Streaks
- Build custom streak logic around any metric to extend streaks.
- Automated notifications
- Trophy turns in-app events into personalized lifecycle emails and push notifications, ready to send.
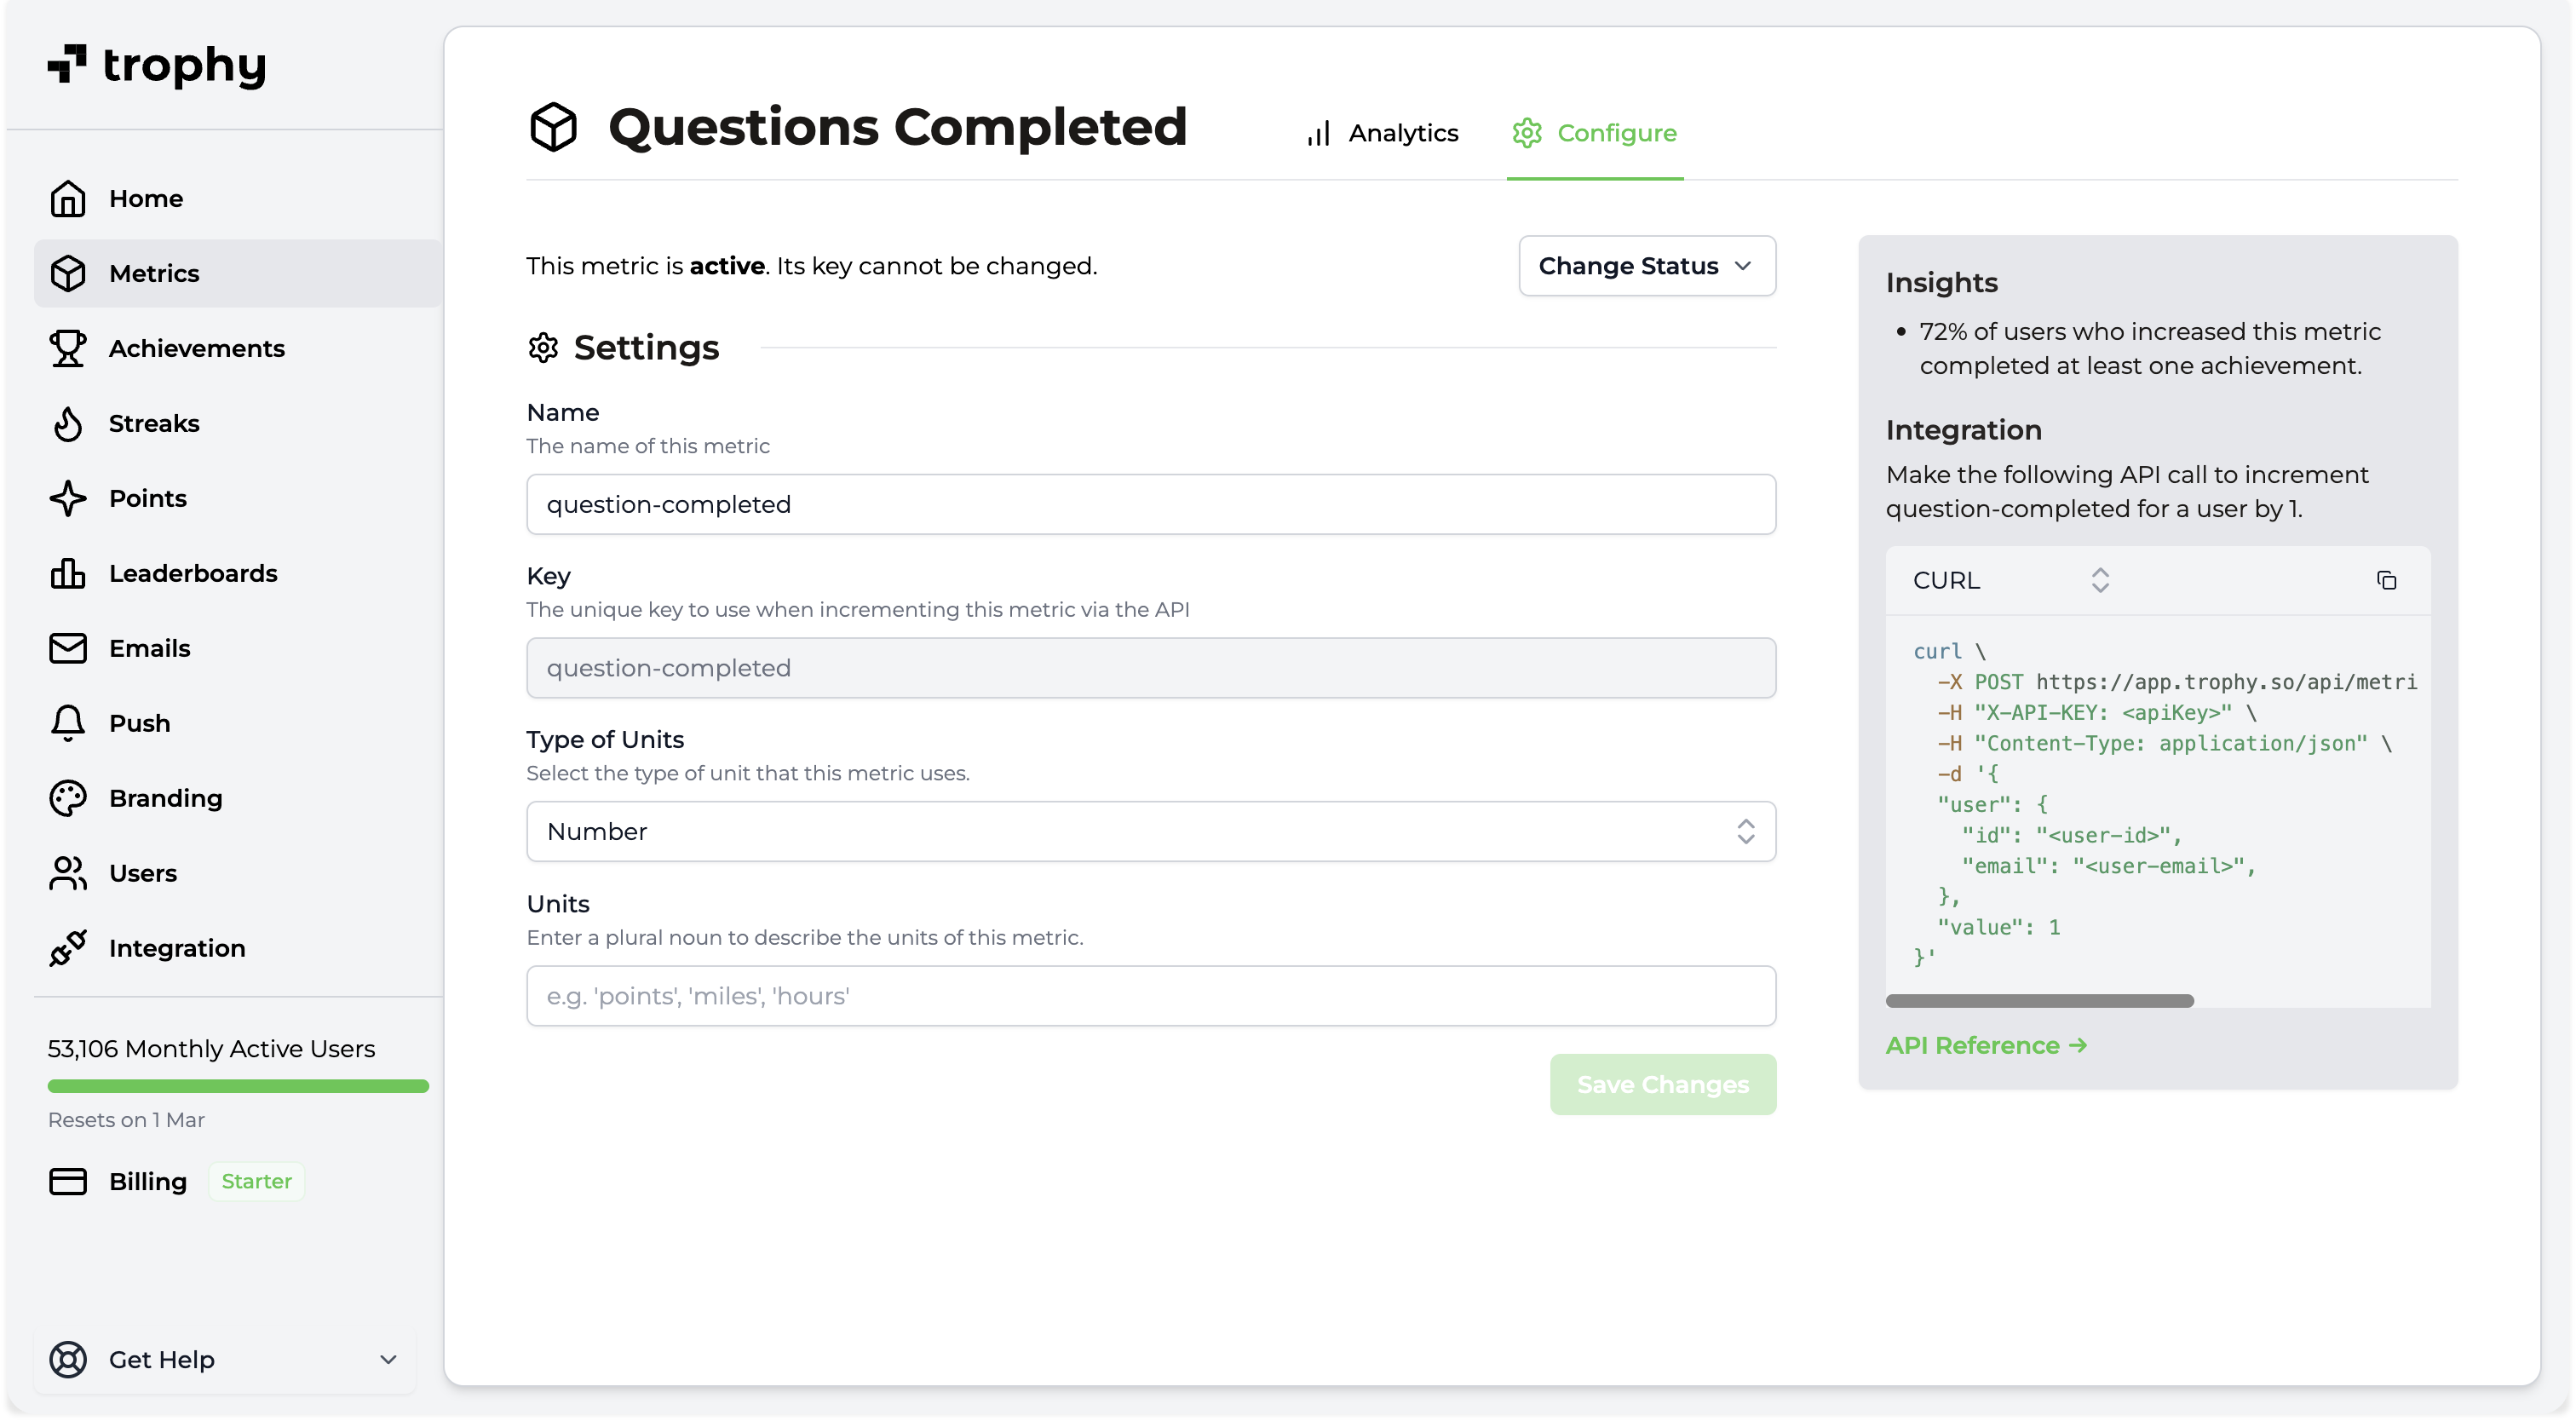
Analytics
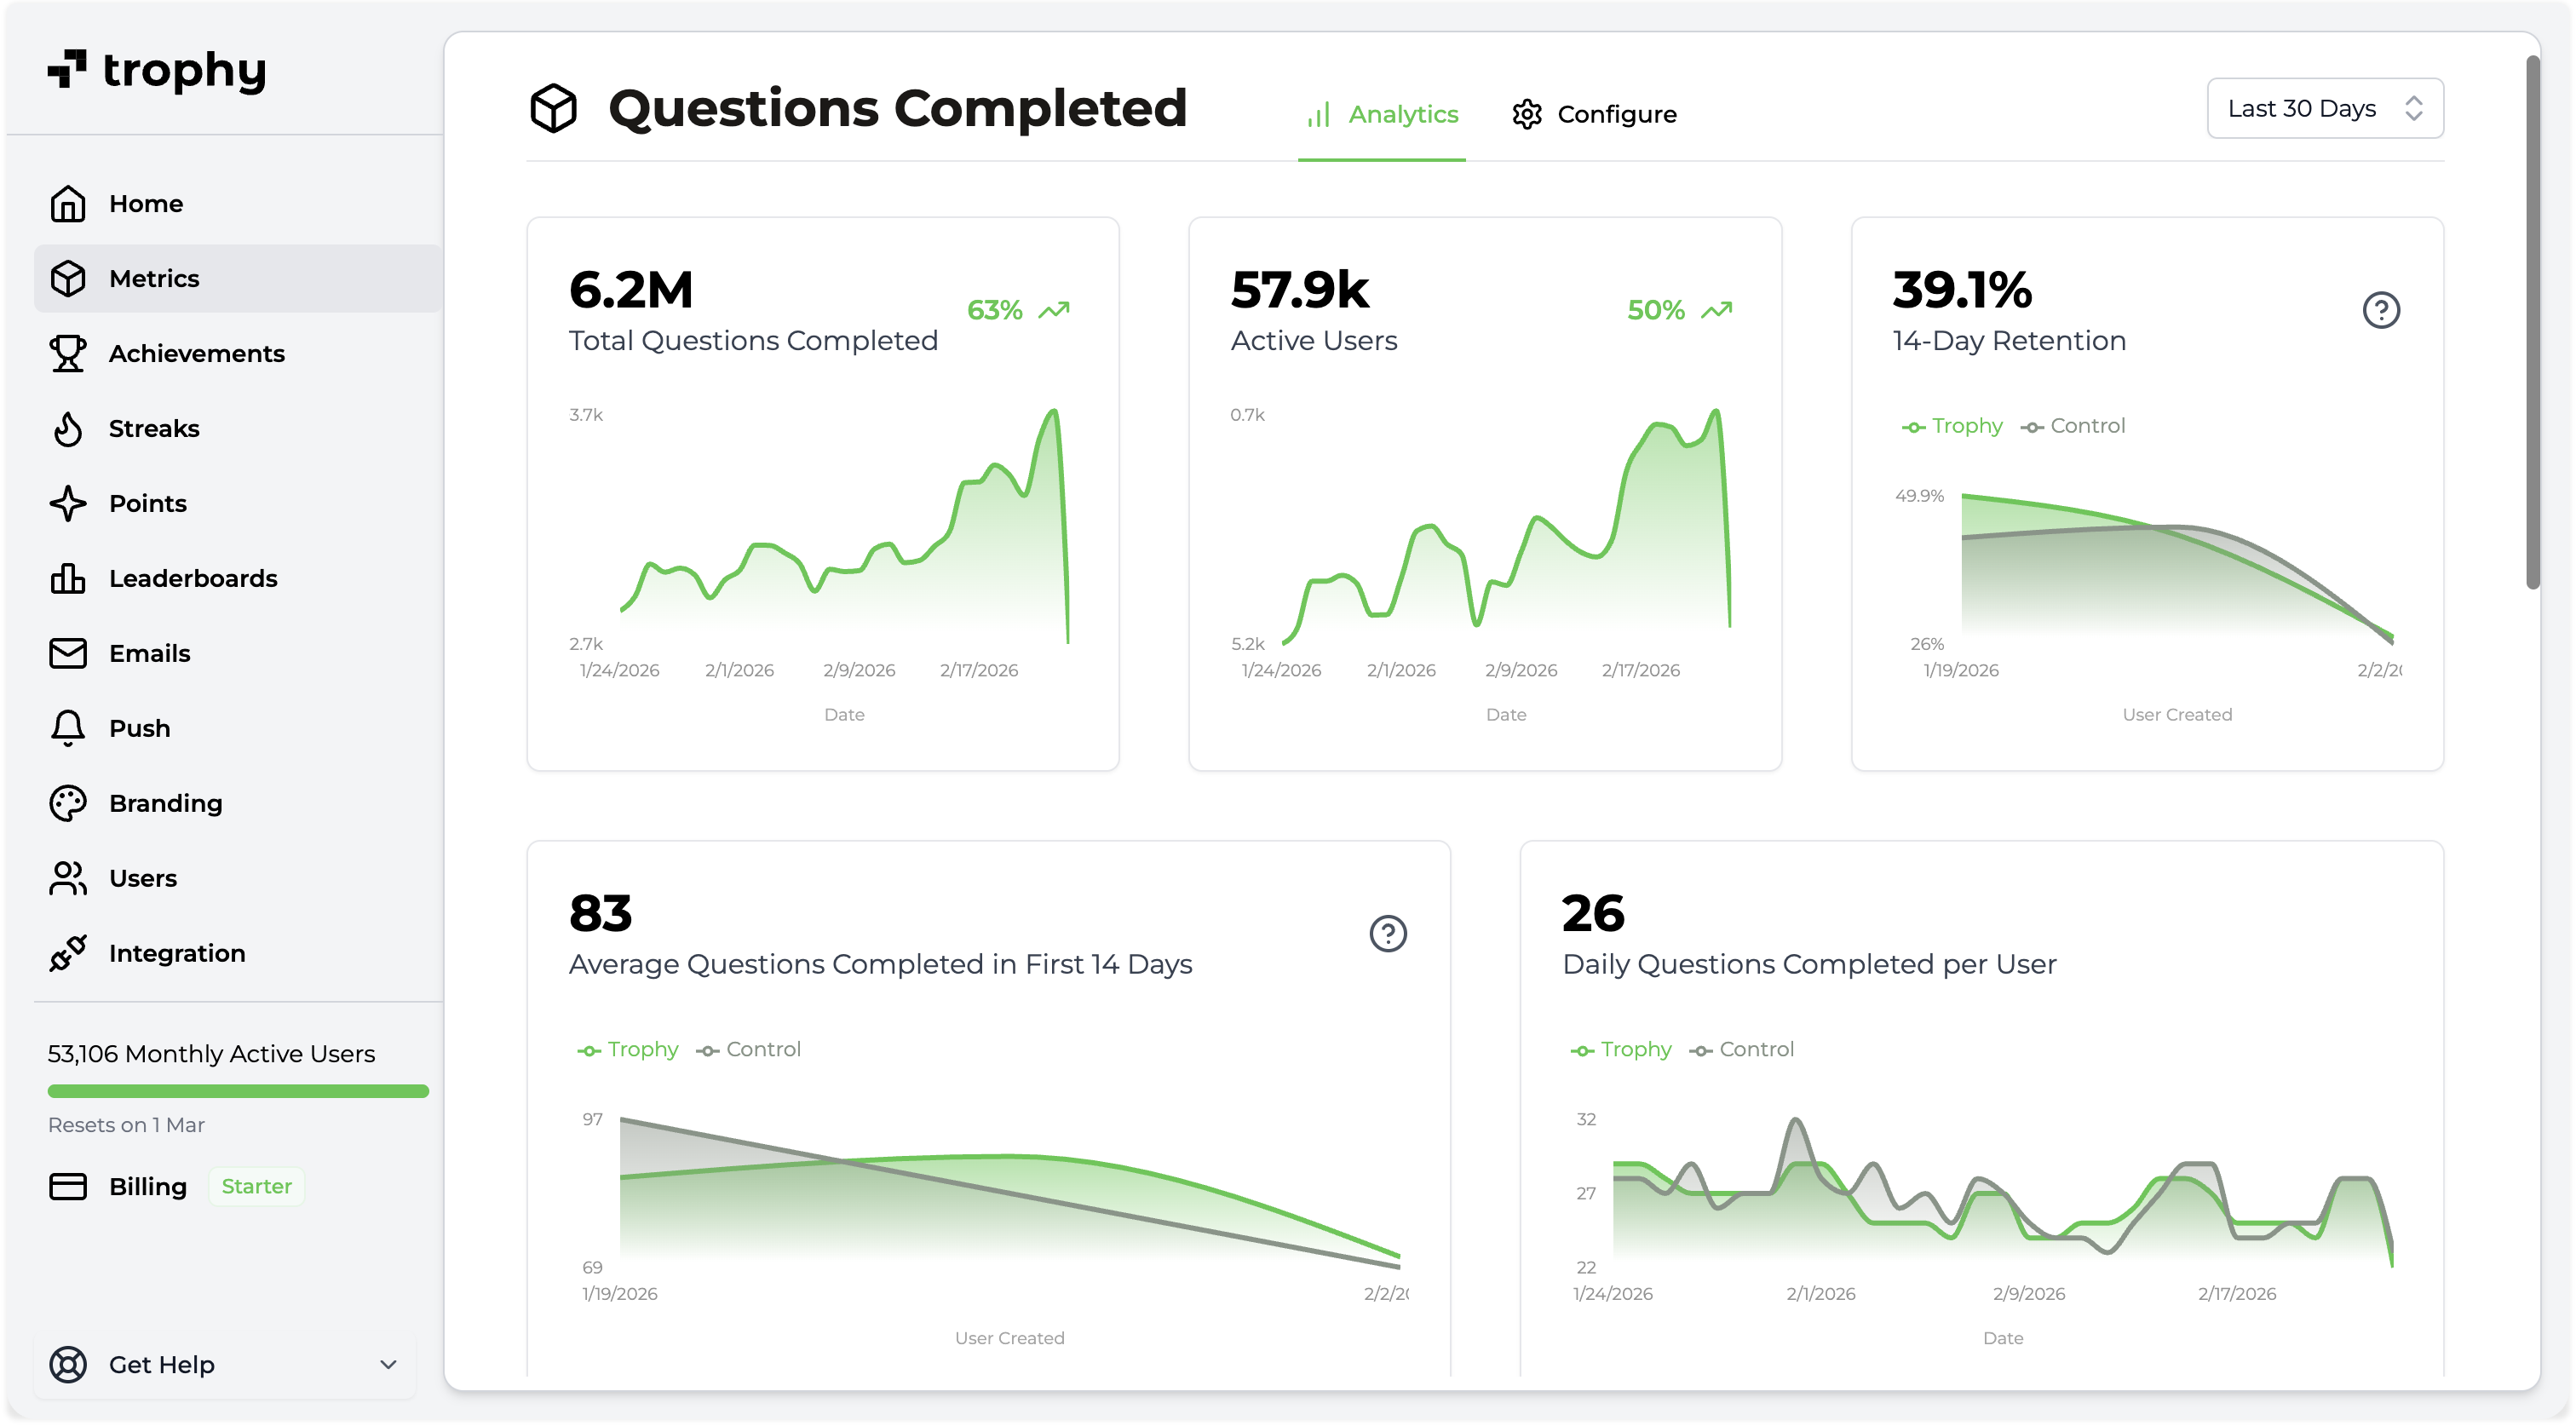
Deeply understand user behavior
Track event volume, slice by cohorts, and understand user behavior to improve your product.
- Track activity volume
- Understand average usage volumes and spot lagging cohorts to optimize your app.
- Segment and analyze
- Create custom cohorts from event attributes to compare behavior across groups of users.
Gamification software for modern product teams
The only gamification platform built for the modern era. Control via API or MCP and wire into your development workflow across multiple environments.
Official Gamification SDKs







// Send engagement events and read daily aggregates
await trophy.metrics.event('distance_run', { user: { id: user.id }, value: 3.2 })
const daily = await trophy.users.metricEventSummary(user.id, 'distance_run', {
  aggregation: 'daily',
  startDate,
  endDate,
})Trophy MCP
Sonnet 4.6 · 8 tools loaded
> Track distance events and add a 30-day daily summary endpoint for our analytics charts
Listed Trophy MCP tools · read metrics and summaries docs
(ctrl+o to expand)
I'll wire ingestion and a normalized 30-day summary:
- Capture distance_run events from activity completion
- Read daily aggregates for the last 30 days
- Normalize response fields for chart components
metrics.create({ name: 'Distance run', key: 'distance_run' })
metrics.event({ key: 'distance_run', userId: 'usr_123', value: 3.2 })
users.metricEventSummary({ userId: 'usr_123', metricKey: 'distance_run', aggregation: 'daily', days: 30 })
Metrics ingestion and daily summaries are live in staging with chart-friendly output, want this in production?



Scale with confidence
Trusted by startups and enterprises alike. Scale seamlessly from your first to your millionth user.
150M
API requests · 30D
168ms
p95 latency · 24H
100.0%
Uptime · 90D
Data encryption
TLS 1.2+ in transit and AES-256 at rest
Privacy-first
Trophy operates without PII by default
Secure API keys
Rotation and revocation on demand
Fault tolerant
Automatic failover through redundancy
Rate limited
Per-endpoint limits maintain fair use
Idempotent
Retry requests without side-effects
Customers
Loved by consumer app teams
Learn why growing product teams are increasing engagement with Trophy.



Get started
Up and running in minutes
FAQ
Frequently asked questions
Have a different question and can’t find the answer you’re looking for? Send us an email.