Apps That Use Streaks: 10 Real Examples Analysed (2026)

Trophy's infrastructure currently supports over 18 million active streaks. Across that dataset, the median daily streak length for users who have passed day two is just four days. Most streaks are short, and most of the design decisions that determine whether a streak survives past that point happen in the first week.
This post covers ten real implementations of streak mechanics, with a specific lesson from each one, drawn from what Trophy's platform data shows about how those design choices play out at scale.
Duolingo: When The Streak Becomes The Product

For a large portion of Duolingo's active users, the streak is no longer a retention mechanic layered on top of language learning. It has become the reason they open the app. Users who stopped caring about improving their Spanish will still log in daily to protect a 400-day streak, which means Duolingo has effectively created a second value proposition built entirely out of gamification infrastructure rather than curriculum changes.
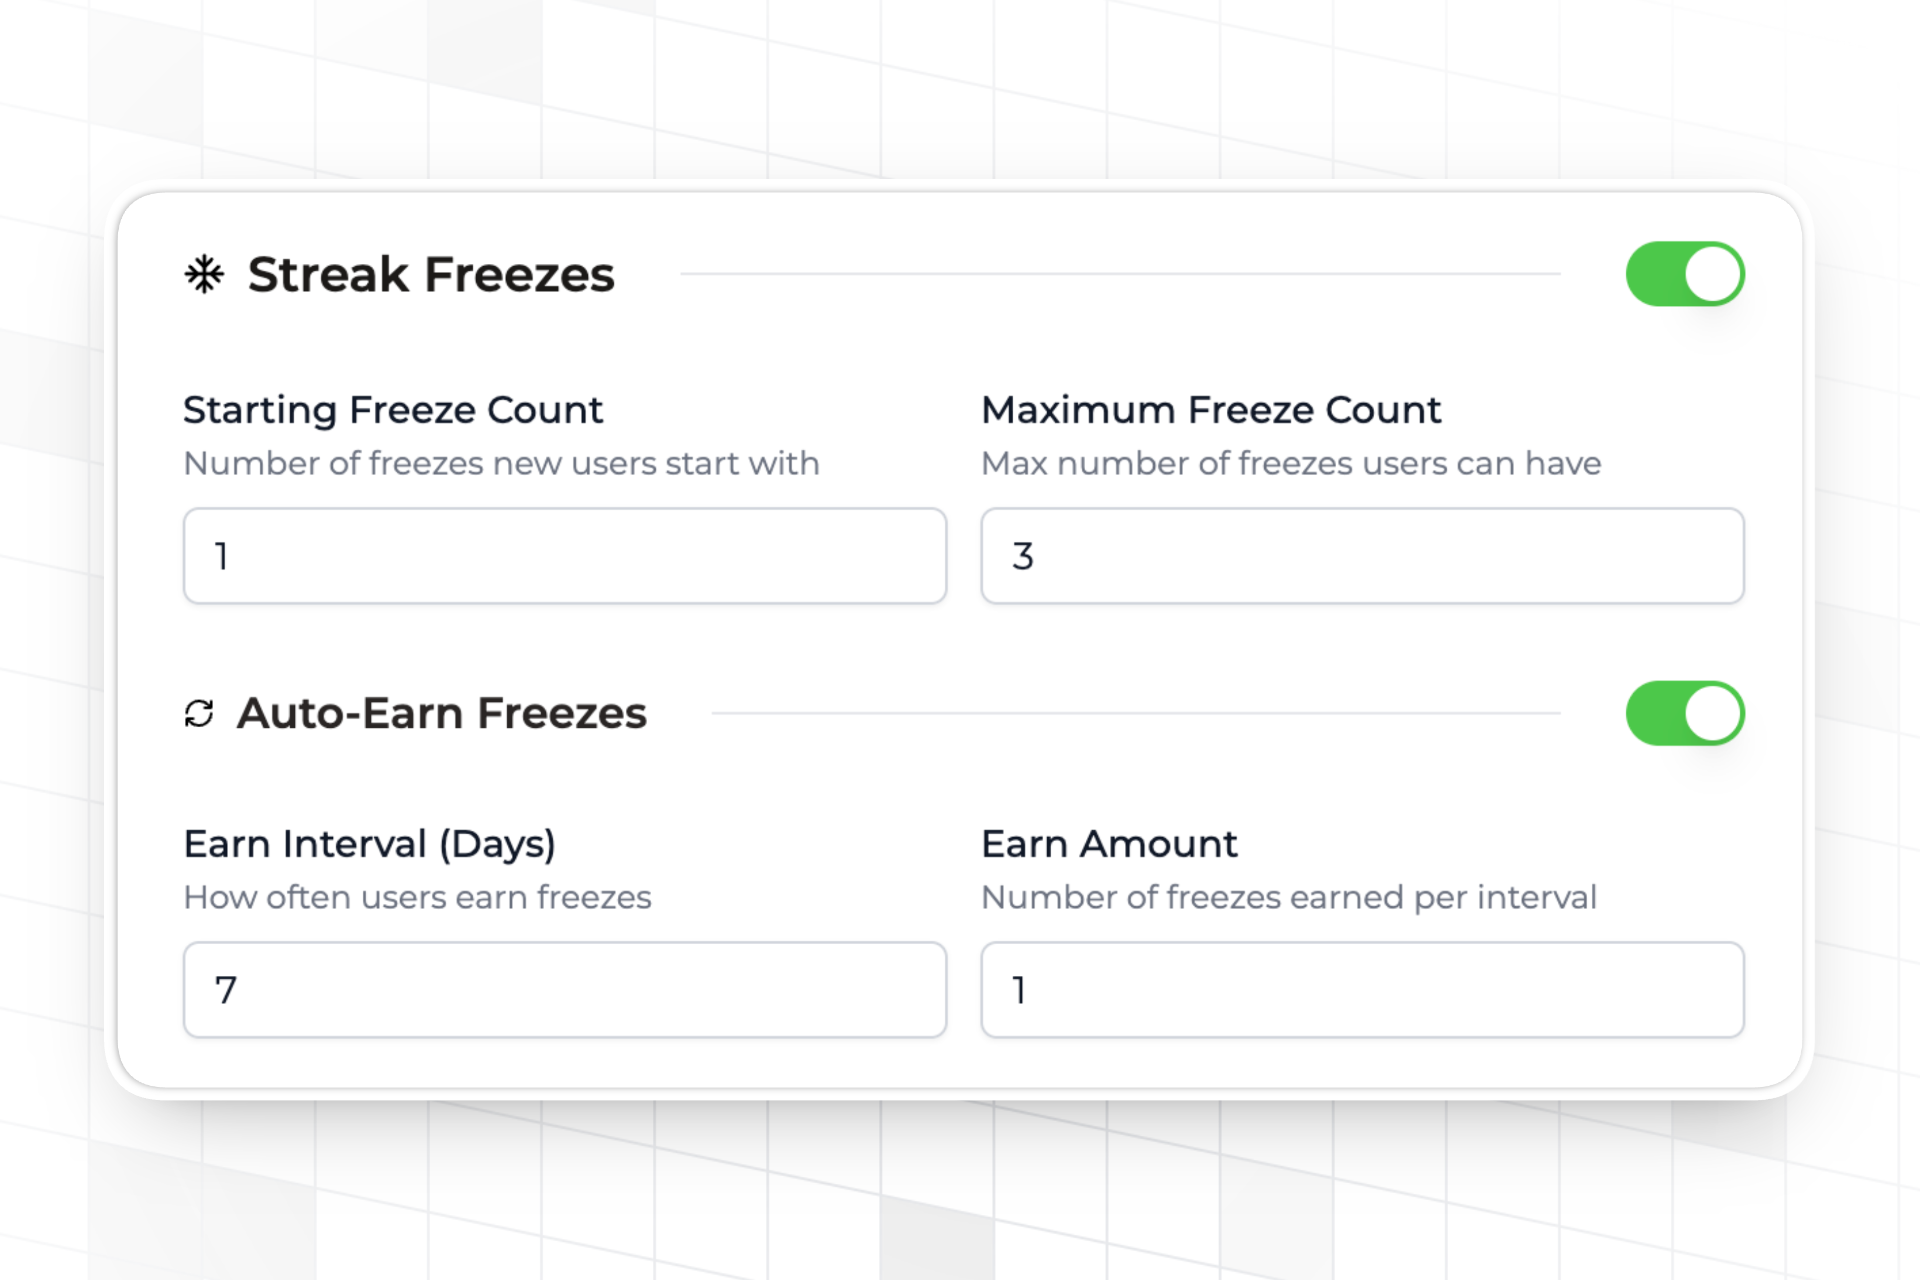
This outcome required sustained product investment beyond a counter. Duolingo built streak freezes to protect users during unavoidable missed days, streak repairs to recover from breaks, a Streak Society social layer for high-count users, and a push notification strategy calibrated to the streak lifecycle rather than general re-engagement. Each layer made the streak more resilient to daily life friction.
Trophy's platform data quantifies how much that freeze infrastructure matters. Among daily streak users who have passed seven days, those on apps with streak freeze functionality average 17.19 days on streak, compared to 11.62 days for those without — a 48% difference in average streak length. For users who have passed fourteen days, the gap widens further: 30.63 days with freezes versus 18.87 days without. The freeze is not a convenience feature; it is a structural component of streak longevity.
| Streak Length | Avg Streak Length (Without Freezes) | Avg Streak Length (With Freezes) |
|---|---|---|
| > 7 days | 11.62 | 17.19 |
| > 14 days | 18.87 | 30.63 |
The practical lesson is that a streak counter alone will not produce Duolingo-scale outcomes. The surrounding infrastructure — recovery mechanics, notification strategy, status signals for high-streak users — is doing most of the retention work. Without those layers, you have a number that resets. With them, you have a retention system.
For a detailed breakdown of how Duolingo's streak mechanics have evolved, see our Duolingo gamification analysis.
Khan Academy: Calibrating Streak Intensity To The Audience
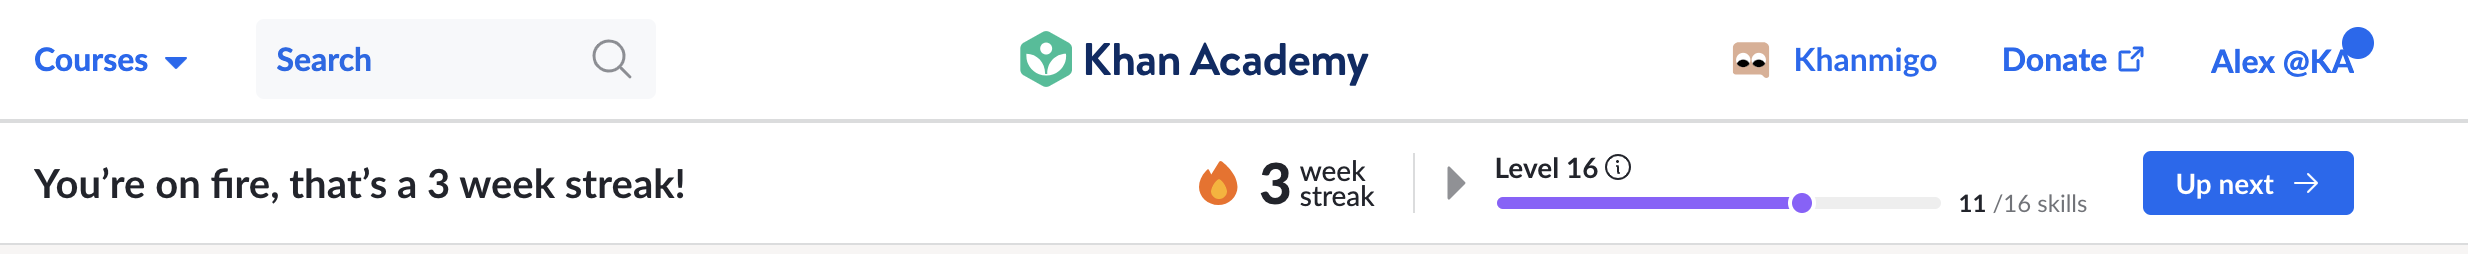
Khan Academy's streak implementation is technically sound but deliberately understated. The streak count is visible, gentle reminders are sent before a break becomes imminent, and consistent engagement is rewarded, but the product stops well short of the social layers and high-visibility streak counts that apps like Duolingo build around theirs.
This fits their context rather than representing a missed opportunity. A substantial portion of Khan Academy's users are on the platform out of obligation: homework, exam preparation, a course requirement. For users already motivated by external pressure, a heavily gamified streak can feel patronising, and in some cases will add anxiety to an activity that already carries its own stakes.
The broader point is that streak intensity should be calibrated to your users' relationship with your product. Intrinsically motivated users — people who are there because they genuinely want to be — respond well to high-visibility streaks, social sharing, and explicit loss aversion mechanics. Users there primarily because they have to be often benefit from a lighter touch. The mechanics are the same; the weight you put on them should vary.
Simply Piano: Connecting The Streak To Skill Progress
Simply Piano offers personalized courses and uses gamified exercises to make learning piano fun and engaging. It provides instant feedback and adapts to your skill level.
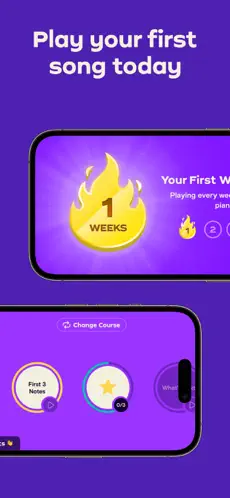
Simply Piano links the streak counter to skill progression indicators rather than displaying it in isolation. When users maintain their streak, the interface reinforces not just that they showed up, but that consistent practice is measurably advancing their playing. This reframes the streak from tracking attendance to tracking investment in a skill.
The psychological difference is meaningful. An attendance streak measures consistency but does not tell the user why consistency matters. Tying the streak to visible skill progress gives it a purpose that extends beyond the gamification layer. Users who can see that their playing has improved since they started their current streak have an intrinsic reason to maintain it, which is more durable than the extrinsic pressure of not wanting to break a number.
Trophy's streak-length-versus-activity data is relevant here. Users in the fifteen-to-thirty-day streak bucket show average daily metric volumes more than three times higher than users in the eight-to-fourteen-day bucket, across Trophy's platform. Longer-streak users are not just more consistent — they are more active, which supports the view that sustained streaks reflect genuine engagement rather than users doing the minimum to preserve a count. Simply Piano's approach, making the connection between streak and outcomes explicit, is likely a factor in producing that kind of engagement rather than the floor-tapping variety.
Strava: What Social Context Adds To Streak Survival
Strava's streak mechanic is worth examining not for how the streak itself is configured, but for what surrounds it. Strava's product is fundamentally social: activities are visible to followers, achievements are shared automatically, and the feed creates community accountability alongside the streak rather than within it.
This social context changes the psychology of streak maintenance in a specific way. A private streak holds you accountable to yourself. When your activity is visible to people whose opinions matter to you, the commitment becomes semi-public, and social identity becomes a second driver alongside loss aversion.
Trophy's platform data supports this at scale. Among users on apps with social streak features — including streak leaderboards — the average streak length is 5.69 days, compared to 4.25 days for users on apps without social features. The 75th percentile gap is more pronounced: 7 days with social features versus 5 days without. The effect is visible across the distribution, not just at the mean.
| Using Social Streaks | Avg Streak Length | p50 Streak Length | p75 Streak Length | p95 Streak Length | p99 Streak Length |
|---|---|---|---|---|---|
| Yes | 5.69 | 4.00 | 7.00 | 12.00 | 22.00 |
| No | 4.25 | 4.00 | 5.00 | 7.00 | 13.00 |
This is not a reason to retrofit social features into every product. It is worth factoring into architecture decisions for products where social elements are already present or planned. If your app has any social layer, integrating streak visibility into it is one of the higher-leverage configuration choices available.
For a broader look at how Strava uses gamification across its product, see our Strava gamification analysis.
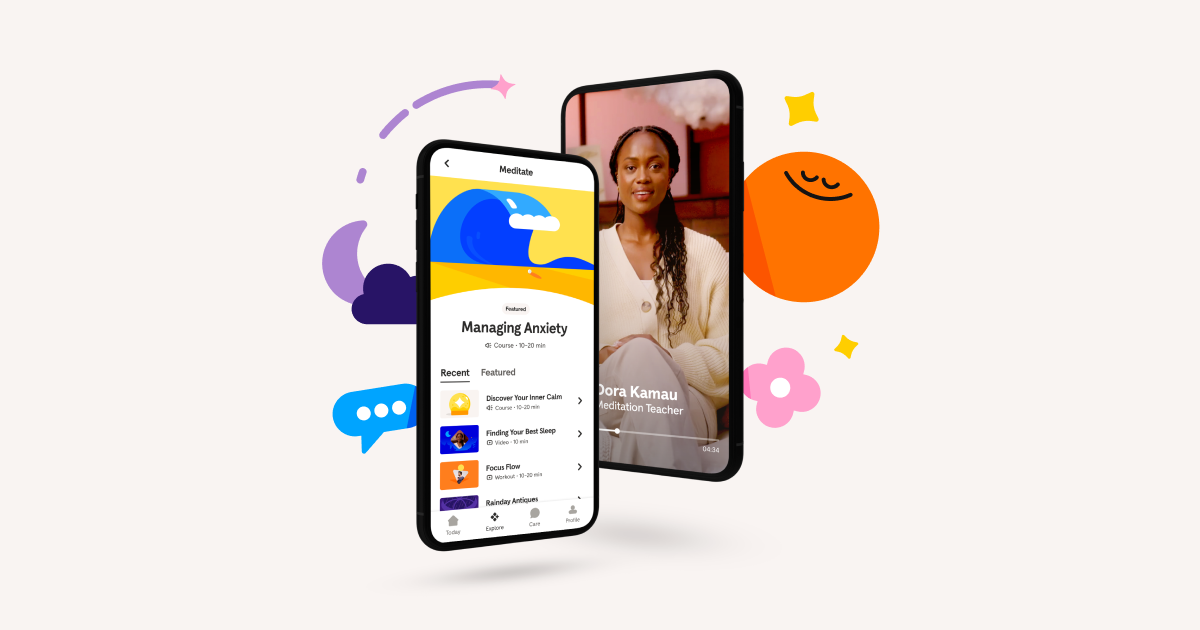
Headspace: The Post-Break Experience Is Part Of The Design
Most streak systems are designed around the active streak. Headspace stands out for paying equal attention to what happens when a streak breaks. The app's messaging on a missed day is notably softer than most, framing the miss as something recoverable rather than a failure state, and offering a path back rather than a hard reset.
Trophy's return rate data makes clear why this matters. Among users who lose a streak of two to three days, only 0.90% return to start a new one. For users who lose a streak of four to seven days, the return rate rises to 1.42%. At fifteen to thirty days, it reaches 2.49%, and at thirty-one to sixty days, 9.09%. Users who had built a streak of sixty-plus days return at a rate of 100% in Trophy's dataset.
| Streak Length | Users Returned (%) |
|---|---|
| 2-3 | 0.90 |
| 4-7 | 1.42 |
| 8-14 | 1.54 |
| 15-30 | 2.49 |
| 31-60 | 9.09 |
| 61+ | 100.00 |
Two things follow from this. First, the post-break experience matters most for users who have invested the most — a break after sixty days is recoverable almost by definition, while a break after three days produces almost no return traffic regardless of how the app responds. Second, the primary objective of streak design in the early days is not protecting the streak; it is getting users to the point where losing it actually hurts. Until a user has a streak worth protecting, the loss aversion that makes streaks work has not yet activated.
This reframes what streak freezes and grace periods are actually for. They are not primarily about protecting long-tenured users — those users tend to recover on their own. They are about reducing early abandonment during the window when the streak is long enough to feel meaningful but short enough that a single bad week can end it.
For apps in emotionally sensitive categories — meditation, mental health, personal finance — the post-break messaging carries additional weight. A broken Headspace streak means you missed a five-minute session. A broken YNAB streak, for many users, lands as evidence that they are bad with money. The mechanics can be similar; the copy cannot.
MyFitnessPal: The Proxy Metric Problem
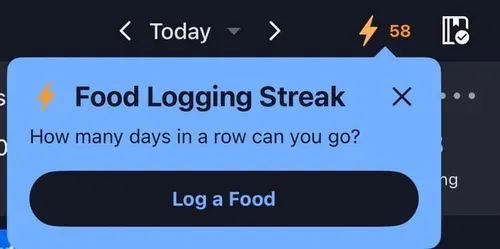
MyFitnessPal's streak tracks consecutive days of logging meals and exercise. It is a good example of a streak mechanic that works in the short term and creates a specific failure mode over time. Logging is a proxy for the actual goal — improved health and fitness. When users become focused on maintaining the logging streak, they start logging for the streak rather than for the quality of the data: incomplete entries, estimated values, late-night submissions made to preserve the count.
At that point the streak is working against the product's purpose. Session frequency goes up while the quality of the underlying behaviour declines. Trophy refers to this as the proxy metric problem: when the gamification mechanic tracks a behaviour that is a means to an end, streak engagement and the outcome the product actually cares about can diverge, and that divergence is only visible if both are being monitored simultaneously.
The relevant design question for any app where the streaked behaviour is instrumental rather than terminal: what is the lowest-quality version of this action that still counts? If that floor is low enough that a user can maintain it indefinitely without producing any real value — logging a single cracker to keep a MyFitnessPal streak alive, for instance — the streak is measuring commitment to the app, not commitment to the goal. That distinction matters more at scale than it does for individual users.
Untappd: Why Tone Can Matter More Than Mechanics

Untappd tracks consecutive days of beer check-ins, which makes it a useful edge case. The app is entirely recreational — nobody needs to check in a beer, and no self-improvement goal is attached to the behaviour. The streak exists purely to increase session frequency among already-engaged users, which means the mechanic has to feel fun rather than obligatory.
Untappd achieves this through social visibility and through framing the streak as a badge of enthusiasm rather than a habit to maintain. The copy and tone around the streak read differently from a productivity or learning app: you are being celebrated for your engagement, not prompted to stay consistent. That distinction matters more than the underlying mechanics. Recreational apps that borrow streak design language built for productivity contexts can feel incongruously pressurising, and that tonal mismatch reduces the effectiveness of the mechanic regardless of how well it is technically configured.
YNAB: High-Friction Categories Require Different Streak Logic
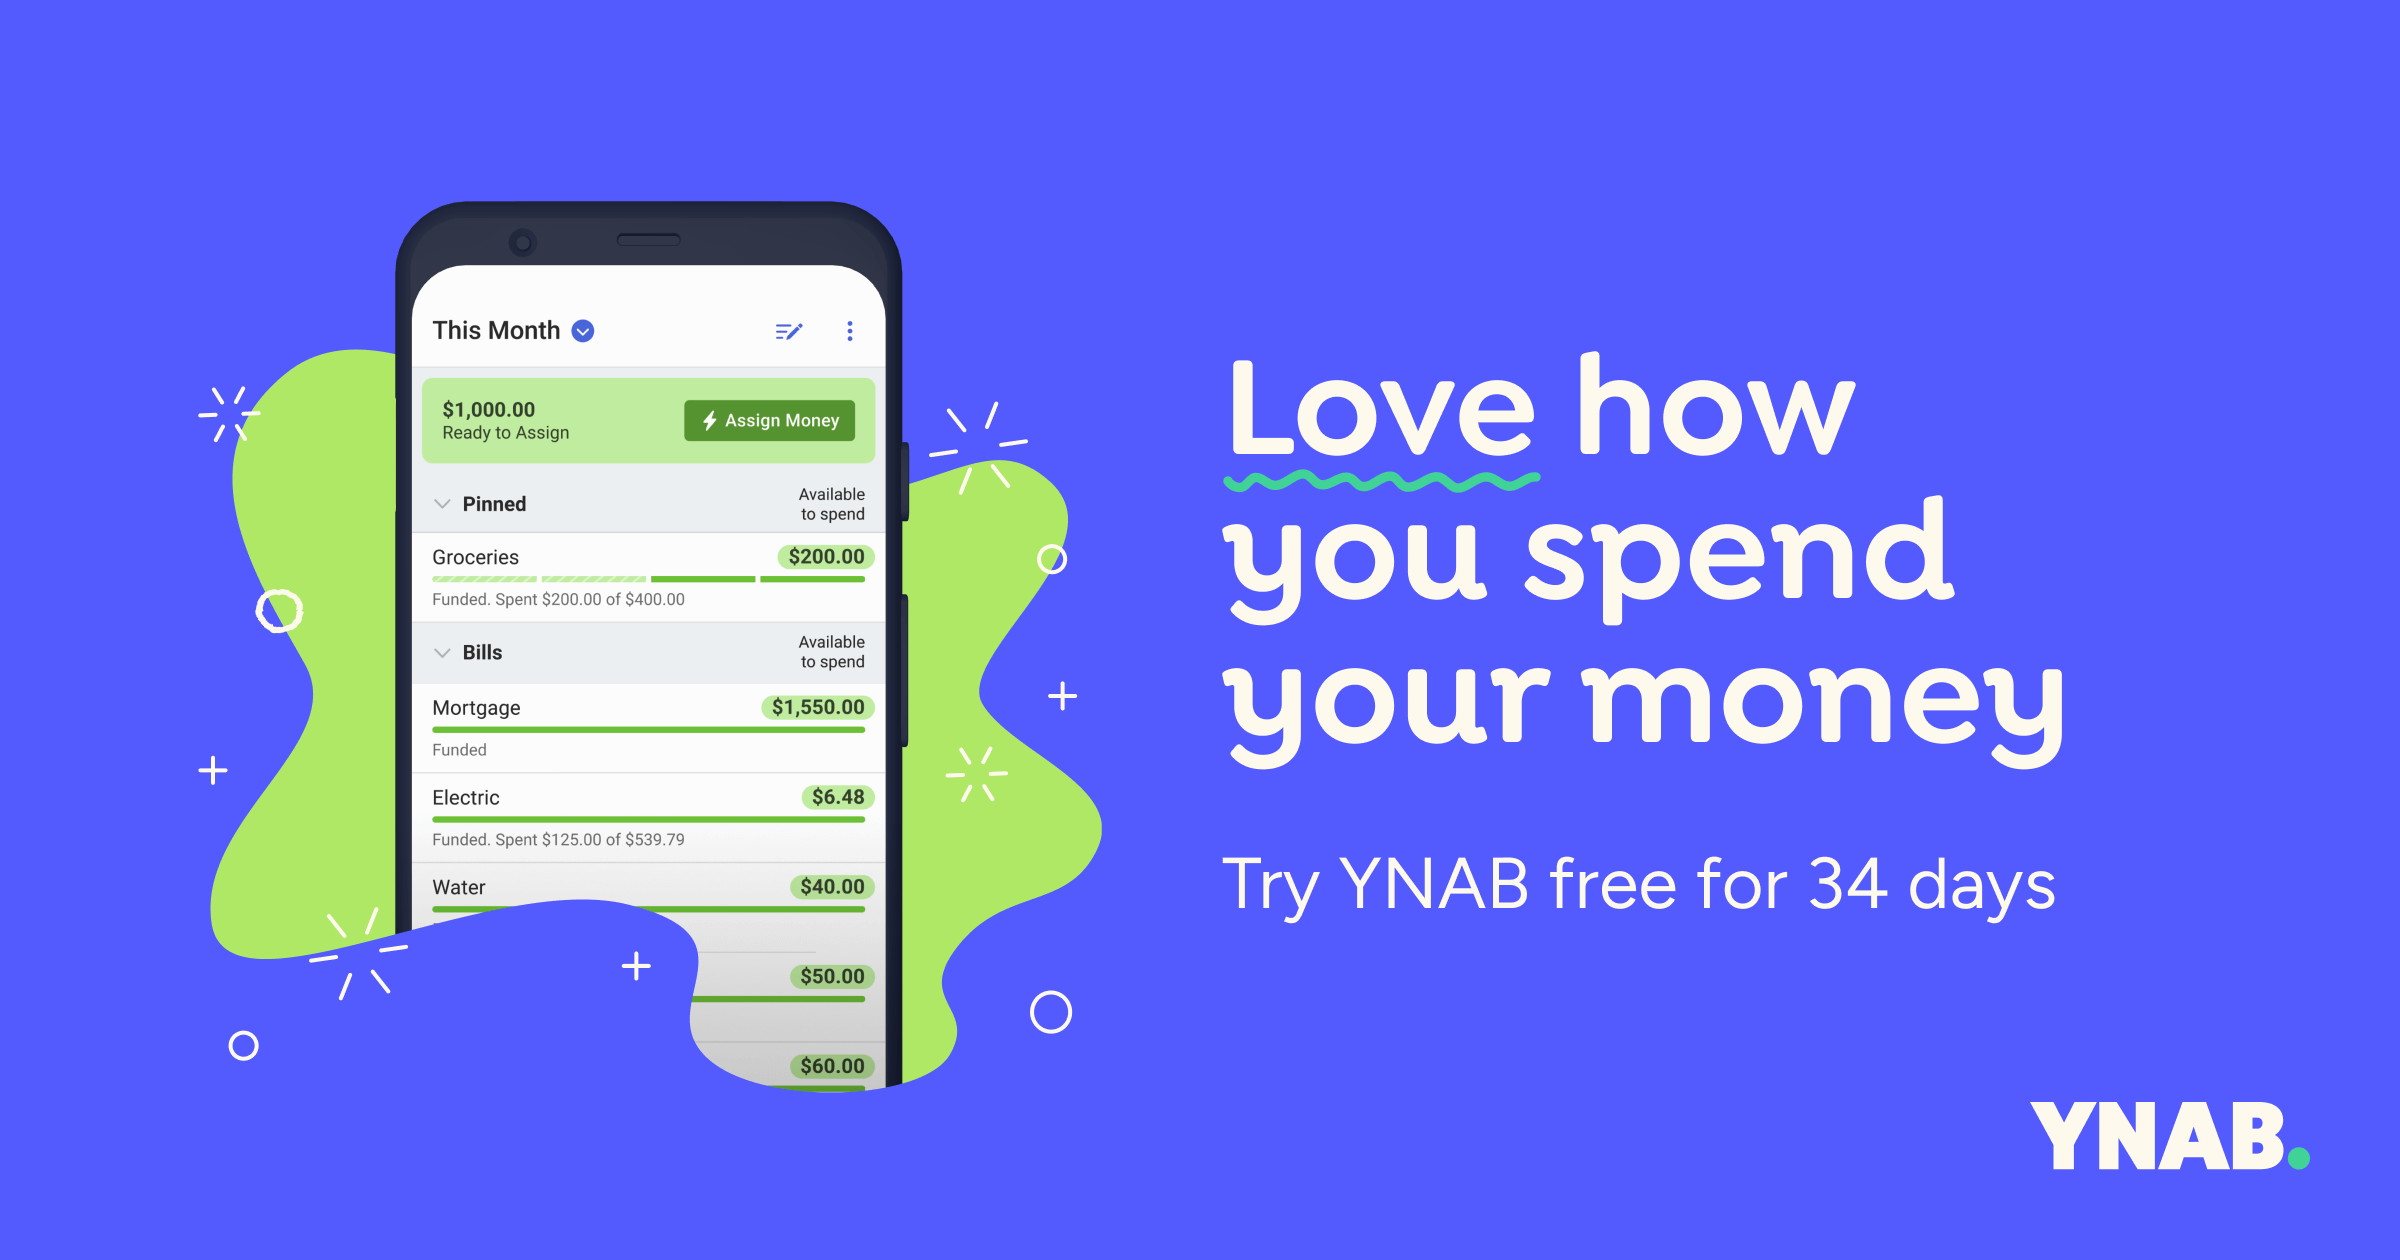
YNAB tracks consecutive days of transaction categorisation, making it one of the more emotionally complex streak implementations. Budgeting carries weight that vocabulary practice or running does not: for many users, financial behaviour is tied to self-image in ways that mean a broken streak is not just a missed day. It can feel like evidence of a character flaw, which is precisely what YNAB's product philosophy is built to counteract.
The streak system in this context has to be designed around emotional stakes as much as behavioural ones. The challenge is not just driving daily logins but ensuring that the streak break experience does not confirm the negative self-narrative the app is trying to help users escape. Recovery mechanics and post-break messaging matter here for the same reasons they matter in Headspace, but with higher emotional stakes per missed event.
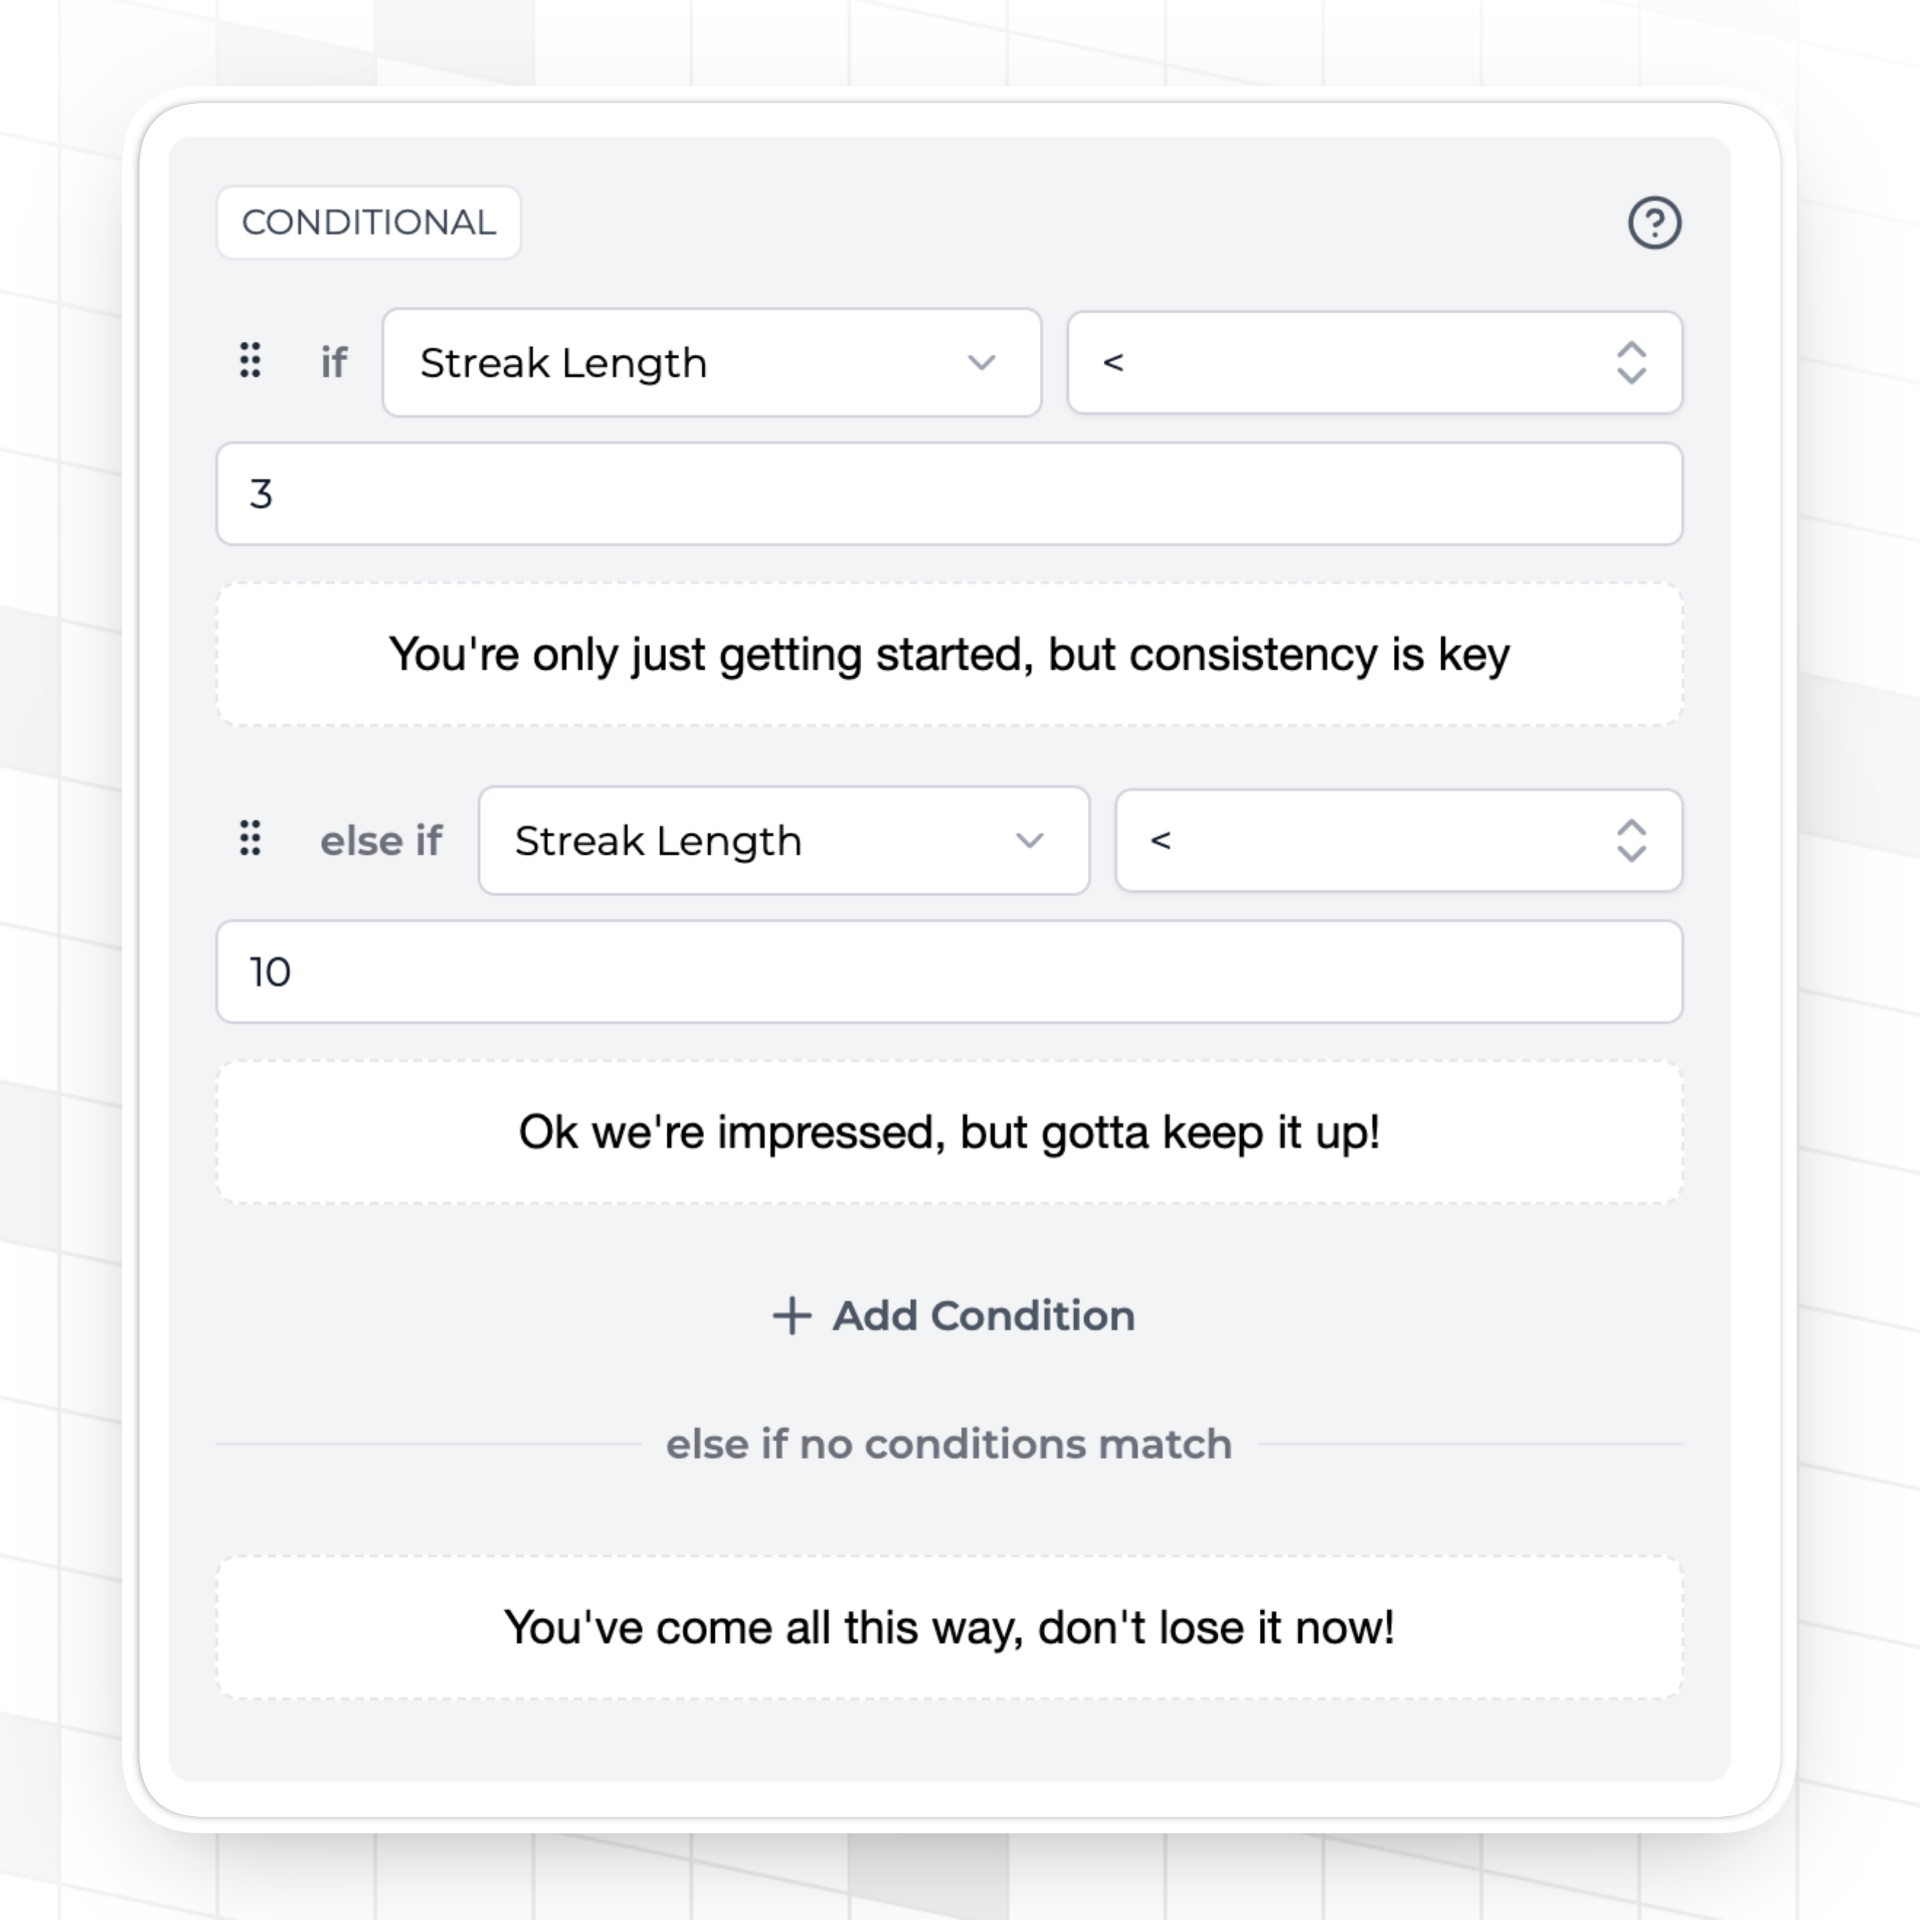
Friday is the single most common day for streak losses in Trophy's daily streak data, accounting for 25.35% of all breaks among users with streaks longer than three days, followed by Saturday at 19.07%. For an app like YNAB, this pattern suggests a specific notification strategy: a Thursday reminder, before the end-of-week disruption hits, will reach users at the point of highest risk. A Sunday re-engagement message can address users who broke on Friday or Saturday before the new week begins. The day-of-week distribution in your own app's streak data is one of the simplest places to find notification timing leverage.
| Day | Share of Streak Losses (%) |
|---|---|
| Monday | 7.07 |
| Tuesday | 12.04 |
| Wednesday | 17.74 |
| Thursday | 13.91 |
| Friday | 25.35 |
| Saturday | 19.07 |
| Sunday | 4.83 |
N.B Data may not sum to 100% due to rounding
Yousician: Positioning Streaks As Evidence Of Learning Principles

Yousician frames the streak not as a gamification mechanic but as proof of a learning principle: daily practice is the single biggest determinant of how fast users improve. This framing gives users a self-interested reason to maintain the streak that sits outside the gamification layer entirely. You are not keeping it alive because the app wants you to open it; you are keeping it alive because you want to improve faster.
This is only available to apps where frequency of use genuinely correlates with outcomes. Language learning, music practice, fitness, and investing all qualify. If your data supports a claim like "users who maintain a fourteen-day streak improve X% faster than those who don't," making that claim directly transforms the streak from a retention mechanic into product advice. Users respond to that framing differently and more durably, because the reason to maintain the streak belongs to them rather than to the app.
Trophy's metric volume data offers a platform-level version of this argument. Users with active daily streaks of fifteen to thirty days average more than four times the daily activity volume of users in the three-to-seven-day bucket. Longer streaks do not just represent users who open the app more often; they represent users who do more when they are there. If your product has an outcome that scales with engagement depth rather than just frequency, the streak is a reasonable proxy for that outcome — and telling users so is legitimate product communication, not just gamification spin.
| Streak Length | Daily Activity Volume |
|---|---|
| 3-7 | 265.27 |
| 8-14 | 353.22 |
| 15-30 | 1090.05 |
N.B Daily activity volume is measure as the users total metric value within each 24hr window.
Nike Run Club: Matching The Streak Frequency To Behaviour
Nike Run Club tracks runs and provides challenges, badges, and leaderboards to encourage users to achieve their fitness goals and compete with friends.

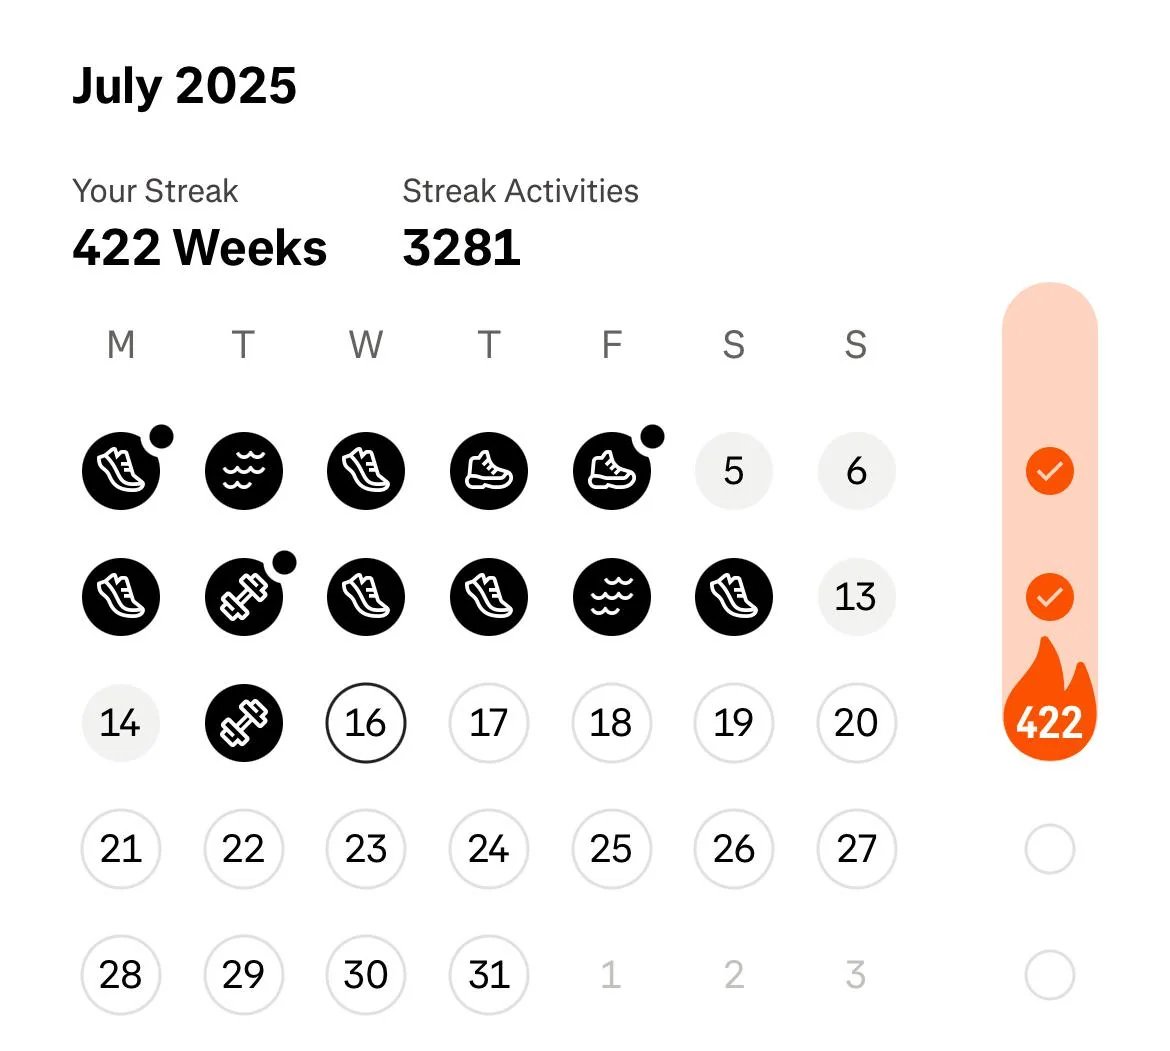
Nike Run Club tracks consecutive weeks of running rather than consecutive days. This is a deliberate design decision, and it points to one of the most commonly misconfigured aspects of streak implementation: aligning the period with the realistic frequency of the target behaviour.
Daily streaks work well for lightweight habits where missing a day is almost always a choice rather than a circumstance. Running is different. Travel, injury, poor weather, and schedule disruption will interrupt a running routine in ways that have nothing to do with motivation. A daily streak system that breaks under those conditions is penalising users for circumstances outside their control, and a streak break that feels unfair produces churn rather than re-engagement.
By moving to a weekly period, NRC significantly reduces unintentional breaks while preserving the consistency pressure that makes streaks useful. A user who runs four times one week and once the next still maintains their streak, because the system is measuring the behaviour it actually cares about: regular running, not perfect daily execution.
Trophy's freeze data offers an interesting secondary observation here. For weekly streak users who have passed seven days, the difference between apps with and without freeze functionality is smaller than for daily streaks: 12.23 days with freezes versus 12.56 days without. The weekly cadence already provides much of the buffer that daily streak users need freezes to get. This is consistent with the logic above — when the period is well-matched to the behaviour, the streak is less likely to break for the wrong reasons, and therefore less dependent on a recovery mechanism.
The general rule: set the streak period to the shortest interval at which missing is almost always a voluntary choice. For vocabulary practice, that is a day. For running, it is a week. For content publishing or financial reviews, it might be longer still. Misaligning the period is the most common streak configuration mistake Trophy sees.
What Trophy's Data Shows Across All Ten
Several consistent patterns emerge when streak performance is viewed across categories rather than within a single app, drawing on Trophy's dataset of over 18 million streaks.
Streak period misalignment is the most common configuration mistake. Apps that configure daily streaks for high-effort behaviours see disproportionately high abandonment at the first life disruption the user encounters. Trophy's freeze impact data shows that weekly streaks are less dependent on freeze infrastructure than daily ones, which is consistent with the period already providing the buffer users need.
Most streaks are short, and the critical window is days three through seven. The median daily streak across Trophy's platform is four days. The decisions that determine whether a streak survives past that point — freeze availability, notification timing, early milestone acknowledgement — have a larger effect on long-term retention than anything done for users who have already reached thirty days.
Post-break recovery rates are extremely low for short streaks and rise sharply above thirty days. Only 0.90% of users who lose a two-to-three-day streak return to start a new one. That figure reaches 9.09% at thirty-one to sixty days. The practical implication is that early streak survival, not post-break recovery, should be the primary design focus for most apps. Getting users to thirty days is what makes recovery mechanics meaningful.
Friday is the highest-risk day across Trophy's daily streak dataset, accounting for more than a quarter of all streak losses. Notification strategies that do not account for end-of-week drop-off are leaving retention leverage on the table. A Thursday prompt before the risk window, and a Sunday re-engagement message after it, is the simplest structural fix.
Social context reliably extends average streak length. Apps with social streak features see average streaks 34% longer than those without, across Trophy's platform. This is a consistent pattern, not an outlier. If social features are already present in your product, integrating streak visibility into them is a high-return configuration choice.
Frequently Asked Questions
What is a streak in app gamification? A streak is a count of consecutive time periods — typically days or weeks — in which a user completes a defined action. Streaks drive retention by creating loss aversion: the longer a streak runs, the more reluctant users become to break it. Across Trophy's platform, the median streak length for active daily users is four days, which means most of the design work that determines long-term streak survival happens in the first week.
Do streak freezes actually improve retention? Yes, and the effect is substantial. Among daily streak users who have passed seven days, those on apps with streak freeze functionality average 17.19 days on streak compared to 11.62 days for those without, across Trophy's platform data. For users past fourteen days, the gap reaches 30.63 days versus 18.87. A streak freeze is not a convenience feature — it is a structural component of streak longevity, particularly for daily streak configurations where a single missed day ends an otherwise healthy streak.
What percentage of users restart a streak after breaking one? Very few, and the rate varies sharply by the length of the streak that was lost. Trophy's return rate data shows that only 0.90% of users who lose a two-to-three-day streak return to build a new one. That figure rises to 1.42% for four-to-seven-day streaks, 2.49% for fifteen-to-thirty-day streaks, and 9.09% for thirty-one-to-sixty-day streaks. Users who had built a streak of sixty-plus days return at 100%. The implication is that early streak survival matters far more than post-break recovery for most apps, because the loss aversion that makes recovery likely has not yet activated for short-streak users.
Should a streak track daily or weekly activity? The appropriate period depends on the realistic frequency of the target behaviour. Daily streaks work well for low-effort habits where missing a day is almost always a choice: vocabulary practice, meditation, brief budget logging. Weekly periods suit higher-effort or schedule-dependent activities — running, gym workouts, music practice — where disruption will cause breaks unrelated to motivation. Trophy's data shows that weekly streaks are also less dependent on freeze infrastructure than daily ones, because the period itself provides the buffer that daily streaks need explicit recovery mechanics to achieve.
What day of the week do most streak breaks happen? Friday accounts for 25.35% of all daily streak losses in Trophy's platform data, among users with streaks longer than three days. Saturday follows at 19.07%. Sunday and Monday are the lowest-risk days at 4.83% and 7.07% respectively. The practical implication for notification strategy is a Thursday prompt to catch users before the end-of-week drop-off, and a Sunday re-engagement message for users who broke over the weekend.
Does adding social features to streaks improve retention? Yes. Apps using social streak features — including streak leaderboards — show an average streak length of 5.69 days versus 4.25 days for those without, across Trophy's platform. The difference is more pronounced at the 75th percentile: 7 days with social features versus 5 days without. This is not a reason to add social features to every product, but for apps where a social layer is already present or planned, integrating streak visibility into it is one of the higher-leverage configuration decisions available.
How do I build a streak feature with Trophy? Trophy's Streaks API handles the infrastructure — period configuration, freeze and grace period logic, milestone triggers, and email and push notification scheduling — so configuration decisions rather than engineering are the focus. The docs cover full integration, and if you want to talk through your specific use case before building, you can book a demo.
Conclusion
The apps above span a wide range of categories and configurations, but none of them are running a streak counter in isolation. In every case, the streak is one component of a larger retention architecture, and the surrounding decisions — period length, freeze availability, notification timing, social context — determine whether it produces the outcomes the product cares about or just the ones that look good in a session-count report. The four days that most streaks survive past before breaking is a short window, and the design choices that extend it are all available before a single line of product code is written.
For a deeper look at the behavioural science behind streak design, see our guide on designing streaks for long-term user growth.
Get the latest on gamification
Product updates, best practices, and insights on retention and engagement — delivered straight to your inbox.