A/B Testing Gamification Features: Patterns, Tools, and Trophy's Built-In Approach

Most teams treat gamification as a feature they add once and never question. Streaks go live, retention improves (or doesn't), and nobody is quite sure which part of the new experience drove the change — or whether the improvement was temporary. Proper A/B testing closes that gap. It tells you whether the gamification system is doing real retention work, which mechanics are pulling their weight, and where you're wasting implementation effort on things users don't respond to.
This post covers the standard A/B testing patterns and tools, why gamification creates specific measurement problems that those patterns don't fully solve, how Trophy's built-in control ratio handles the gamification-specific problem, and how to connect Trophy with external experimentation tools using custom user attributes when you need more granular test design.
Standard A/B Testing Patterns
A/B testing at its simplest is random assignment: split your users into two groups, show each group a different experience, measure which group performs better on a target metric, and ship the winner. The standard implementation looks like this:
// Basic feature flag pattern — most tools follow this shape
import { LaunchDarkly } from 'launchdarkly-node-server-sdk';

const client = LaunchDarkly.init(process.env.LD_SDK_KEY);

async function shouldShowStreaks(userId: string): Promise<boolean> {
  const user = { key: userId };
  return await client.variation('show-streaks-feature', user, false);
}

// In your route/component
const showStreaks = await shouldShowStreaks(req.user.id);
if (showStreaks) {
  // Show streak UI, send streak emails, etc.
}
The major tools — LaunchDarkly, Optimizely, Split, GrowthBook — all follow this same pattern. You define a flag, assign users to variants via the tool's SDK, read the variant at render time, and measure outcomes against your analytics platform. The mechanics are well understood.
Three concepts matter for any A/B test, but are especially critical for gamification:
Randomisation unit. You assign users, not sessions. A user must stay in the same variant across every session for the duration of the experiment, otherwise you can't attribute their behaviour to a specific experience. Most tools hash user IDs to produce stable assignments.
Primary metric. For most product experiments, this is a click-through rate or a short-term conversion. For gamification, the right metric is retention — typically 14-day or 30-day — which means experiments take longer to produce significant results. You cannot read a gamification test after a week and draw conclusions.
Statistical significance. You need enough users and enough time before any result is meaningful. Running a test on 200 users for five days will produce noise, not signal. Rule of thumb: aim for at least 1,000 users per variant and run for a minimum of two full weeks, ideally four.
Why Gamification A/B Testing Is Harder Than It Looks
The novelty effect
Any new feature produces a short-term engagement lift from novelty. Users interact with streaks because they're new, not because they're motivating. If you measure your gamification test over the first two weeks, you'll almost certainly see positive results — and then watch them erode. The novelty effect can last anywhere from one to four weeks depending on how engaging the feature is, which is why four-week test windows are the minimum for gamification and why retention (not engagement volume) is the right primary metric. Retention holds up after novelty fades; raw engagement volume doesn't.
The contamination problem
Standard A/B tests assume the two groups don't interact. Gamification breaks this assumption in several ways. A leaderboard test where 50% of users see a leaderboard and 50% don't still shows the same leaderboard to the 50% who are included — and those users will mention it to their friends in the excluded group. A streak feature that sends reminder emails to test users but not control users changes the email behaviour of the whole cohort. If you're testing a social challenge feature, the absence of the feature for control-group users is visible to the test group ("why can't you join my challenge?").
Measuring the right counterfactual
The question a gamification A/B test answers is not "do users with gamification engage more?" — it's "does gamification cause more engagement than would have happened without it?" Engaged users will naturally accumulate longer streaks and higher XP, which means any analysis that looks at "users with long streaks retain better" is just measuring the correlation between engagement and engagement. The control group is the counterfactual: it tells you what would have happened if gamification hadn't existed.
This is why gamification A/B tests need to be set up before launch, not after. Once users have been exposed to gamification features, you can't construct a clean control group retroactively.
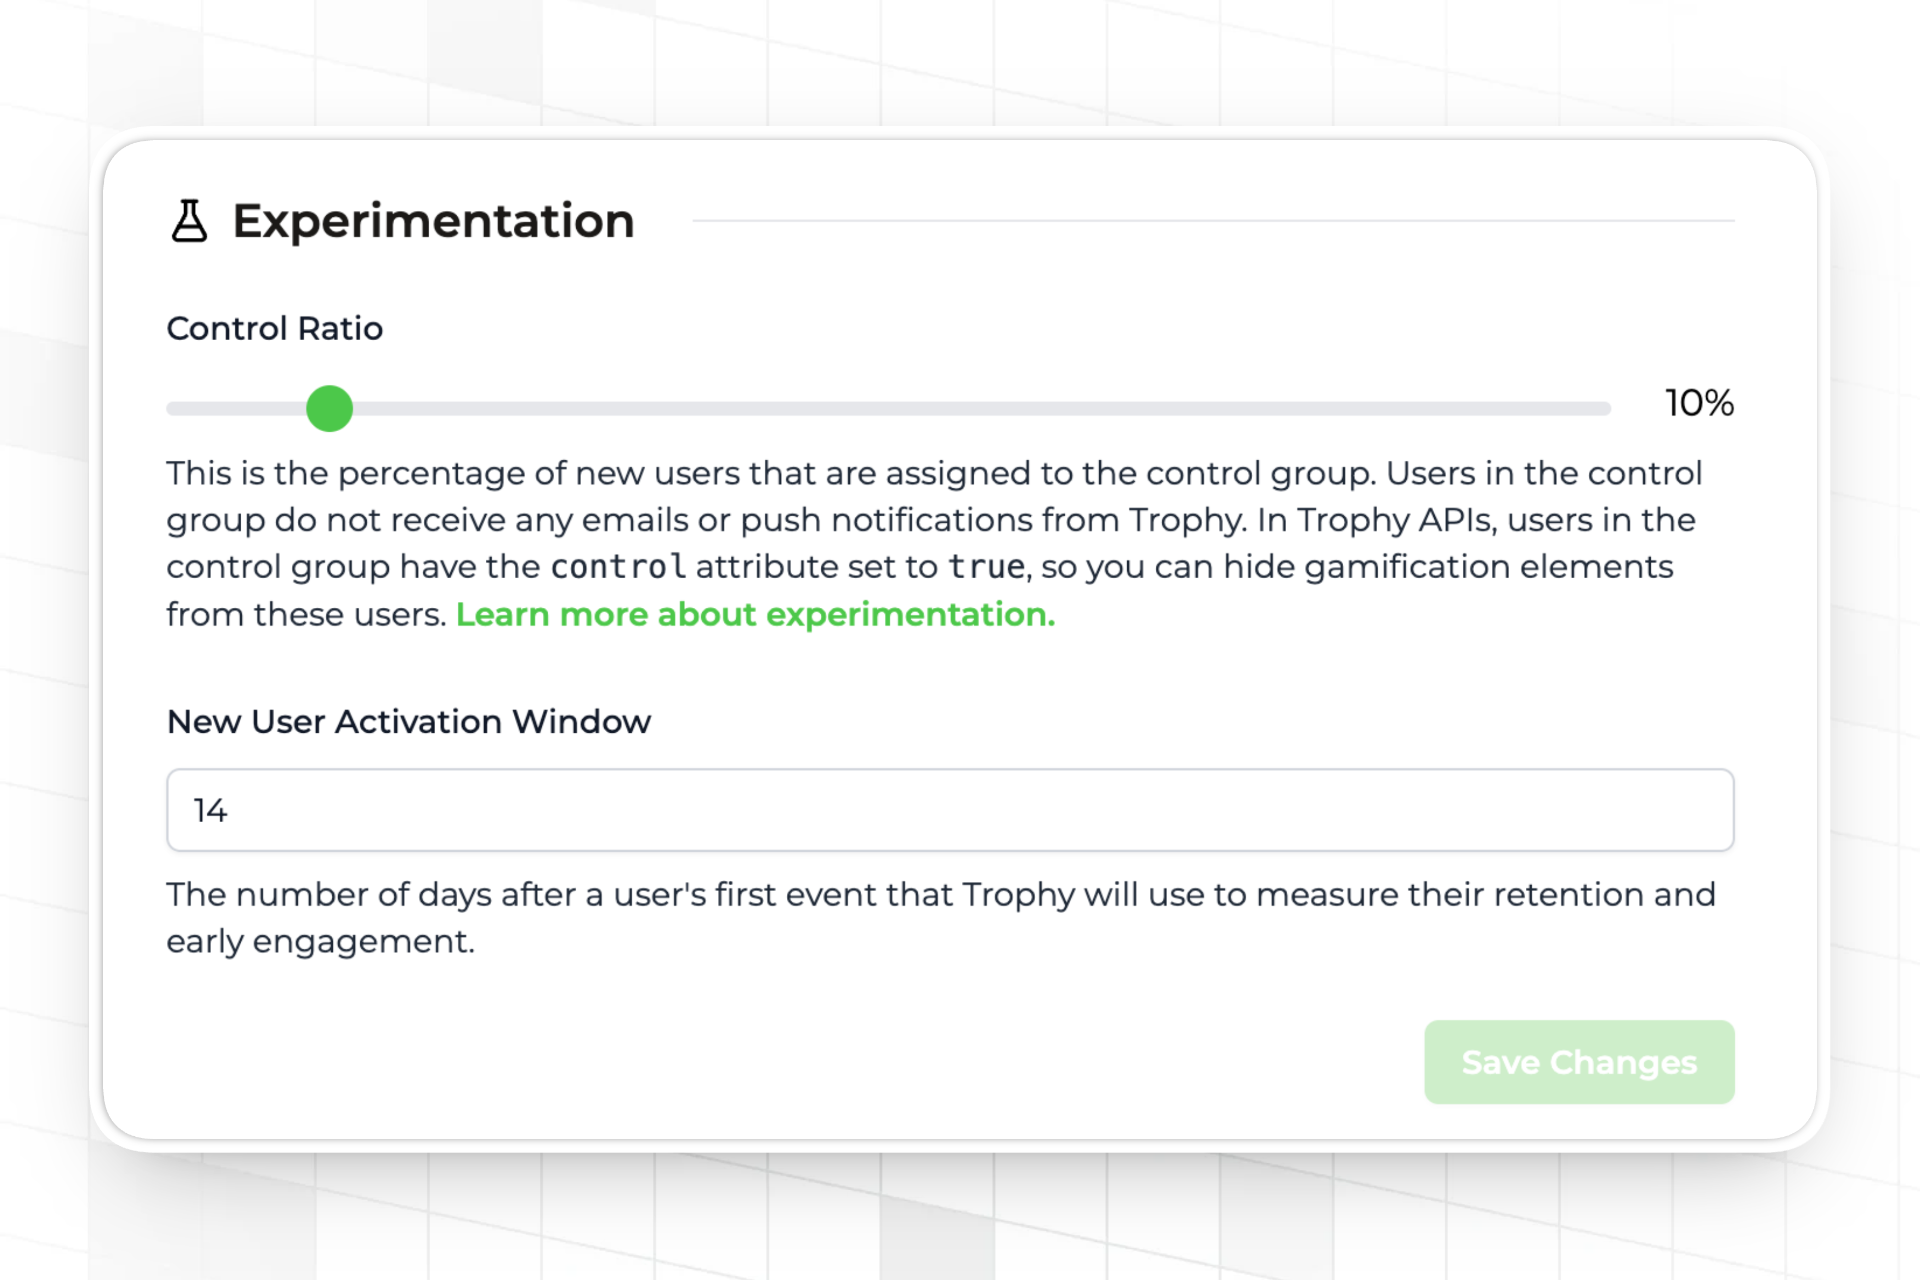
Trophy's Built-In Control Ratio
Trophy has a control ratio setting on the integration page. You set a percentage — say, 10% — and Trophy assigns that share of new users to a control group. Trophy handles isolation at both layers:
- The
controlfield on all user API responses returnstruefor control users — read this to hide gamification UI in your own application - Trophy suppresses all achievement emails, streak reminder emails, and push notifications for control users automatically — no code required on your side
- Trophy continues to track points, streaks, achievements, and all other gamification data for both groups, so the analytics comparison is based on identical instrumentation
- Trophy's dashboards compare retention and engagement between the two groups directly
Read the control field on sign-in or app load and pass it to your frontend to gate gamification UI:
import { TrophyApiClient } from '@trophyso/node';

const trophy = new TrophyApiClient({ apiKey: process.env.TROPHY_API_KEY });

async function getUserContext(userId: string) {
  // identify returns the full user object including the control flag
  // {
  //   id, email, name, tz, subscribeToEmails, attributes,
  //   control: false,   // true for control group users
  //   created, updated, deviceTokens
  // }
  const user = await trophy.users.identify(userId, {
    name: req.user.name,
    email: req.user.email,
    tz: req.user.timezone,
  });

  return {
    // Pass this to your frontend to conditionally render gamification UI
    showGamification: !user.control,
  };
}
// In your frontend — only render gamification UI for experimental users
function UserDashboard({ showGamification }: { showGamification: boolean }) {
  return (
    <div>
      <CoreProductUI />
      {showGamification && <StreakWidget />}
      {showGamification && <AchievementsPanel />}
      {showGamification && <Leaderboard />}
    </div>
  );
}
The 10% control ratio is a reasonable starting point. It gives you a clean counterfactual without withholding gamification from a large share of users. Once you have statistical significance — typically after 30 days with sufficient user volume — you can review the retention comparison in Trophy's analytics dashboard and make a decision about whether to ship, adjust, or roll back.
Integrating Trophy with External A/B Testing Tools
Trophy's control ratio answers one specific question: does gamification as a whole improve retention versus no gamification? For more granular test designs — does streak variant A outperform streak variant B, does showing leaderboards at day 1 or day 7 produce better long-term engagement — you need your existing experimentation tool to assign users to variants, and Trophy to deliver different gamification configurations to each cohort.
Custom user attributes are the bridge between the two systems. You pass the variant assignment from your experimentation tool to Trophy as an attribute, then use Trophy's attribute filters to gate which gamification features each cohort receives.
Step 1: Create the attribute in Trophy
In the Trophy dashboard, create a custom user attribute — for example ab_variant with a key of ab_variant. This must exist in Trophy before you can set values against it.
Step 2: Assign users in your experimentation tool and pass the variant to Trophy
import { LaunchDarkly } from 'launchdarkly-node-server-sdk';
import { TrophyApiClient } from '@trophyso/node';

const ld = LaunchDarkly.init(process.env.LD_SDK_KEY);
const trophy = new TrophyApiClient({ apiKey: process.env.TROPHY_API_KEY });

async function identifyUser(userId: string, userEmail: string) {
  // Get the variant from LaunchDarkly (or Optimizely, Split, GrowthBook, etc.)
  const variant = await ld.variation(
    'streak-design-test',
    { key: userId },
    'control'
  );
  // variant will be 'control', 'variant_a', or 'variant_b'

  // Pass the variant to Trophy as a custom user attribute
  await trophy.users.identify(userId, {
    email: userEmail,
    attributes: {
      ab_variant: variant,
    },
  });

  return variant;
}
Step 3: Use Trophy's attribute filters to gate features per cohort
With the variant stored as an attribute, you can configure Trophy features to apply only to specific cohorts. Achievement triggers, points triggers, and leaderboard breakdowns all support attribute filters. For example, you might configure a "streak freeze granted at day 1" achievement only for variant_a users, while variant_b users receive it at day 7:
// When tracking activity, pass the attribute inline — Trophy applies
// the right configuration for each user's cohort automatically
await trophy.metrics.event('lessons_completed', {
  user: {
    id: userId,
    attributes: {
      ab_variant: variant, // Ensures Trophy always has the current value
    },
  },
  value: 1,
});
Because Trophy's achievement, points, and leaderboard features all honour attribute filters, the variant assignment flows through automatically. A user in variant_a receives the day-1 freeze achievement; a user in variant_b does not — no branching logic required in your application code.
Step 4: Measure outcomes in both systems
Your experimentation tool measures the metrics it's configured to track. Trophy's analytics dashboard provides the gamification-specific retention and engagement data. For a complete picture, you need both: the experimentation tool tells you whether the variant assignment had a statistically significant effect on your primary metric; Trophy tells you how the gamification mechanics themselves differed between cohorts — different streak lengths, different achievement completion rates, different engagement trajectories.
This is the key advantage of the attribute-based integration over rolling your own feature flags for gamification: Trophy's analytics layer remains intact for both cohorts, so you can see not just whether variant A retained better, but how the gamification system behaved differently to produce that outcome.
The Reverse Integration: Using Trophy's Control Flag in External Tools
If your primary experimentation platform is LaunchDarkly, Optimizely, or similar, you may want Trophy's control group assignment to flow into your experiment tracking rather than maintaining two separate systems. You can do this by reading Trophy's control flag and reporting it as a user property in your analytics tool:
async function setupUserContext(userId: string) {
  const user = await trophy.users.identify(userId, {
    email: req.user.email,
  });

  // Report the Trophy control assignment to your analytics tool
  // so you can segment experiment results by gamification exposure
  analytics.identify(userId, {
    gamification_group: user.control ? 'control' : 'experimental',
  });

  return user;
}
With this property in your analytics platform, any experiment you run can be segmented by gamification exposure — useful for understanding whether gamification effects interact with other product changes you're testing simultaneously.
FAQ
How long should a gamification A/B test run?
A minimum of four weeks for daily-use apps. Two weeks is the absolute floor, and only appropriate for high-volume apps where you can accumulate statistically significant samples quickly. The novelty effect typically peaks in the first two weeks and fades through weeks three and four — a test that ends before week three is measuring novelty, not retention.
What percentage of users should be in the control group?
10-20% is the standard range. Lower percentages give you more users experiencing the full product (better for user experience and revenue), but take longer to accumulate significance. Higher percentages give you faster results but withold gamification from a larger share of paying users. Start at 10% and increase if your user volume is too low to reach significance in a reasonable timeframe.
Can I run multiple gamification tests simultaneously?
Yes, but with care. Overlapping tests can interact in ways that make results hard to interpret — a user in the "aggressive streak reminders" test and the "harder achievement thresholds" test simultaneously is experiencing a compound treatment that's hard to attribute. The safest approach is to run one gamification test at a time. If you need to run multiple tests, use separate user cohorts with no overlap and ensure your control group is isolated from both.
Should I use Trophy's control ratio or build my own flag-based control group?
Use Trophy's control ratio if your question is "does gamification as a whole improve retention?" It's the simplest correct approach because it handles complete isolation automatically — including withholding emails and push notifications, which flag-based approaches often miss. Use a flag-based approach connected via custom user attributes when your question is about specific mechanic variants: which achievement design works better, when to introduce leaderboards, how streak freeze timing affects completion.
How do I know when I have statistical significance?
Use a sample size calculator before starting the test — input your baseline retention rate, the minimum improvement you'd consider meaningful, and your desired confidence level (typically 95%). This gives you the number of users and days you need. Don't peek at results mid-test and stop early if the result looks positive — early stopping inflates false positive rates significantly.
Where to Go Next
Trophy's experimentation docs — Retention, Engagement, and the Overview — cover the control ratio setup, the retention window configuration, and how the analytics dashboards compare cohorts. The custom user attributes documentation covers creating and setting attributes for the external tool integration pattern.
For the measurement layer that sits alongside A/B testing, How to Measure Points and Levels Across All Your Users covers Trophy's built-in analytics in more depth. And if you're deciding whether gamification is worth adding before you've shipped it, How to Build a Gamification Feature for Your App covers the design decisions that precede testing.
Get the latest on gamification
Product updates, best practices, and insights on retention and engagement — delivered straight to your inbox.